IC Markets Home Sign in Web Trader Contáctanos
IC Markets Social IC Markets Social

Información para
Operadores Serios

  • Acerca de IC Markets
  • ABRA UNA CUENTA BURSÁTIL
  • PRUEBE UNA DEMO GRATIS
  • Comienza a Operar
  • VISIT OUR BLOG
IC Markets Social
  • Acerca de IC Markets
  • ABRA UNA CUENTA BURSÁTIL
  • PRUEBE UNA DEMO GRATIS
  • Comienza a Operar
  • VISIT OUR BLOG
May 7, 2021North_American_Stocks_enIC Markets

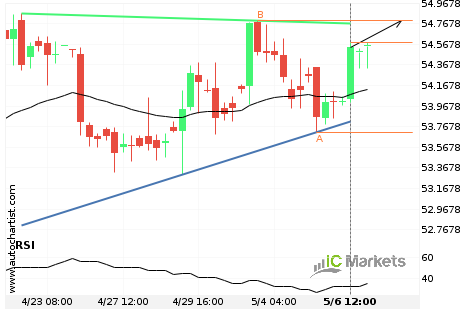
Should we expect a breakout or a rebound on Coca-Cola Co.?

The movement of Coca-Cola Co. towards the resistance line of a Ascending Triangle is yet another test of the line it reached numerous times in the past. We expect this line test to happen in the next 2 days, but it is uncertain whether it will result in a breakout through this line, or simply […]

Read more
May 6, 2021North_American_Stocks_enIC Markets

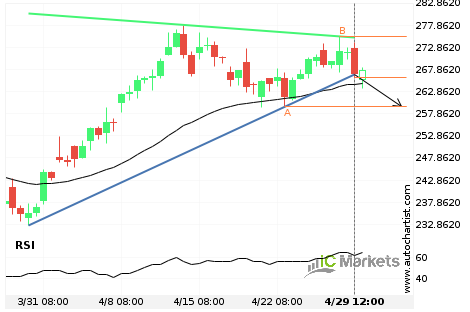
Apple Inc. – getting close to resistance of a Channel Down

Apple Inc. is moving towards the resistance line of a Channel Down. Because we have seen it retrace from this line before, we could see either a break through this line, or a rebound back to current levels. It has touched this line numerous times in the last 19 days and may test it again […]

Read more
May 5, 2021North_American_Stocks_enIC Markets

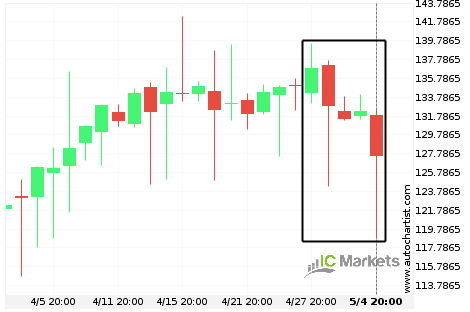
What’s going on with Apple Inc.?

Those of you that are trend followers are probably eagerly watching Apple Inc. to see if its latest 6.82% move continues. If not, the mean-reversion people out there will be delighted to cash in on this exceptionally large 8 days move.

Read more
May 4, 2021North_American_Stocks_enIC Markets

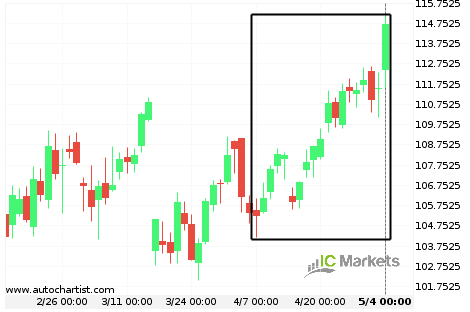
Huge bullish move on AbbVie

AbbVie has moved higher by 9% from 105.53 to 114.68 in the last 28 days.

Read more
May 3, 2021North_American_Stocks_enIC Markets

Resistance line breached by US Small Cap 2000 Index

US Small Cap 2000 Index has broken through the resistance line which it has tested twice in the past. We have seen it retrace from this position before, so one should wait for confirmation of the breakout before trading. If this new trend persists, a target line of around 2294.2978 can be expected within the […]

Read more
April 30, 2021North_American_Stocks_enIC Markets

Will Paypal Holdings Corp have enough momentum to break support?

Paypal Holdings Corp is heading towards the support line of a Triangle and could reach this point within the next 3 days. It has tested this line numerous times in the past, and this time could be no different from the past, ending in a rebound instead of a breakout. If the breakout doesn’t happen, […]

Read more
April 29, 2021North_American_Stocks_enIC Markets

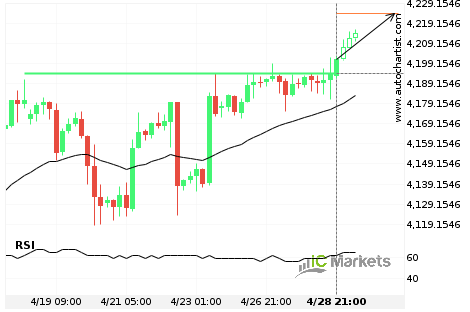
Important price line breached by US SPX 500 Index

US SPX 500 Index has broken through a line of 4194.2002 which it has tested numerous times in the past. We have seen it retrace from this position in the past, one should wait for confirmation of the breakout before trading. If this new trend persists, a target line of around 4223.8901 can be expected […]

Read more
April 28, 2021North_American_Stocks_enIC Markets

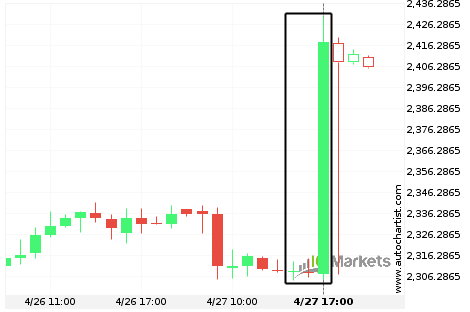
ALPHABET INC CLASS C experienced an exceptionally large movement

For those of you that don’t believe in trends, this may be an opportunity to take advantage of an exceptional 4.44% move on ALPHABET INC CLASS C. The movement has happened over the last 3 hours. For those trend followers among you, you may think about riding this trend.

Read more
April 27, 2021North_American_Stocks_enIC Markets

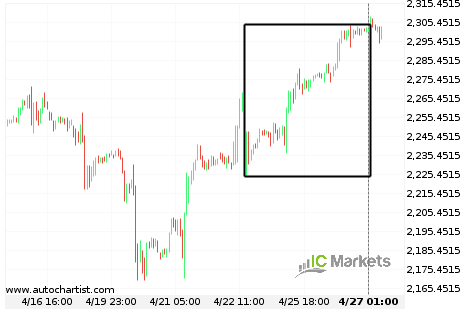
US Small Cap 2000 Index experienced an exceptionally large movement

For those of you that don’t believe in trends, this may be an opportunity to take advantage of an exceptional 2.57% move on US Small Cap 2000 Index. The movement has happened over the last 5 days. For those trend followers among you, you may think about riding this trend.

Read more
April 26, 2021North_American_Stocks_enIC Markets

US Small Cap 2000 Index is on its way up

US Small Cap 2000 Index has experienced an exceptionally large movement higher by 1.52% from 2,231.71 to 2,278.05 in the last 4 days.

Read more
  • 1
  • 2
  • 3
  • …
  • 37
  • 38
  • 39
  • 40
  • 41
  • 42
  • 43
  • …
  • 45
  • 46
  • 47

Recent Posts

  • US Wall Street 30 Index – المستوى الرئيسي – مقاومة
  • Brent Oil vs US Dollar – نموذج الرسم البياني – قناة صاعدة
  • Brent Oil vs US Dollar – نموذج الرسم البياني – قناة صاعدة
  • Hong Kong 50 Index – نموذج الرسم البياني – مثلث صاعد
  • Hong Kong 50 Index – รูปแบบกราฟ – สามเหลี่ยมขาขึ้น

Recent Comments

    Traducción


     Edit Translation

    Opere con un

    líder del mercado en el que puede confiar

    ABRA UNA CUENTA BURSÁTIL PRUEBE UNA DEMO GRATIS

    Trading en Forex

    • Qué es Raw Spread
    • Resumen de cuentas
    • Abre una Cuenta
    • Trader Launch en Web

    Especificaciones de Trading

    • Spreads y Comisiones
    • Rango de Mercados
    • Horas de Trading
    • Depósitos
    • Retiros

    Acerca de IC Markets

    • Help Center
    • Por qué con IC Markets
    • Regulación
    • Documentos Legales
    • Contáctanos


    Forex Trading

    • Accounts Overview
    • Open an Account
    • Launch Web Trader

    Trading Specifications

    • Spreads and Commissions
    • Range of Market
    • Trading Hours
    • Funding
    • Withdrawal

    About IC Markets

    • Chat with a Specialist 24/7
    • Why IC Markets
    • Regulation
    • Legal Documents
    • Contáctanos

    Descargo de responsabilidad: Estos documentos son material de marketing cuyo contenido es publicado solo con propósitos informativos. Este material no contiene y no debe ser considerado un consejo de inversión y recomendaciones, o sugerencias para llevar a cabo otras acciones con los instrumentos financieros. Los widgets integrados pertenecen a sus autores independientes externo, y IC Markets no es responsable de su contenido o cómo afectan en las operaciones.

    Derechos reservados de todo el contenido. Las opiniones de los autores tal vez no coincidan con la opinión de los editores del blog. Cuando copie material de este sitio o conecte RSS para volver a publicar nuestros artículos, es obligatorio el enlace a IC Markets o la atribución en el formato “Blog de IC Market”. Para dudas generales, por favor, póngase en contacto con la oficina editorial a través de la página “Contacto”.

    Advertencia de riesgo: Operar derivados conlleva un altor riesgo en su capital y solo debería operar con capital que puede permitirse perder. Las operaciones con derivados podrían no ser adecuadas para todos los inversores, por lo tanto, asegúrese de entender por completo los riesgos que conlleva y buscar asesoramiento independiente si fuera necesario. Una Declaración de Divulgación del Producto (PDS, por sus siglas en inglés) se tendrá en cuenta antes de participar en una transacción con nosotros.

    Los contenidos de esta página son solo información general y no tienen en cuenta su situación personal, objetivos financieros o necesidades. Depende de usted garantizar que los productos que ofrecemos se ajustas a sus necesidades específicas. No debería operar con nosotros a menos que entienda las características y riesgos de los productos que ofrecemos. Esto significa que tal vez necesite buscar asesoramiento independiente antes de empezar a operar con nosotros.

    © 2022 Raw Trading Ltd | All rights reserved.
    • Sample Page